Apple's Sampler file format, and SBCL SB-SPROF report generation
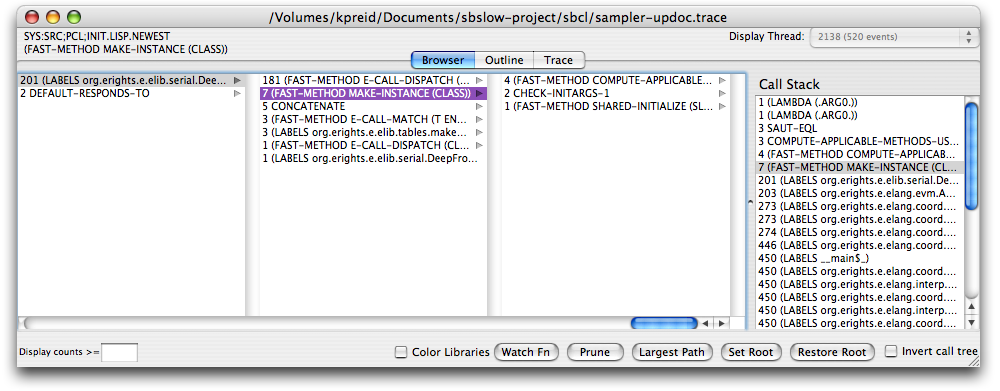
Thursday, June 19th, 2008 10:01Apple's Sampler is a profiler based on the principle of periodically collecting the entire call stack of the executing threads, then summarizing these stacks to show what occurs frequently; primarily, as a tree, rooted at the bottom of the stack, where each node shows the number of times that call sequence was found on the stack.
SBCL's sb-sprof is a profiler which also collects call stacks, but its summary report is much less useful to me as it does not provide the per-branch counting; just top-of-stack frequencies and a caller/callee graph.
Therefore, I examined Sampler's file format and wrote code to generate it from sb-sprof's record.
The file is mixed text/binary, LF line endings. The grammar, as far as I've determined it, is:
  "@supersamplerV1.0" LF
  "@symboltableV1.1" LF
  (TAB int32<id> TAB int32<unknown>
   TAB text<symbol>
   TAB text<library-path> TAB text<library-path> LF)*
  "@end" LF
  (
    "@threadV1.0" TAB int16Hex<thread-id> LF
    (
      TAB int32<1> int32<0> int32<1> int32<count of stack-frame> (int32<stack-frame>)* LF
    )*
  )*
  "@end" LF
where by "int32" I mean a big-endian 32-bit (unsigned?) integer (i.e. four not-necessarily-ASCII bytes), and by "int16Hex" I mean a 16-bit integer in hexadecimal (i.e. four ASCII bytes).
"id" is an arbitrary identifier for this symbol. "unknown" is occasionally nonzero, but I don't know what it means. "symbol" is the name of a function/method found on the stack. "library-path" is the pathname to the object file it was loaded from (relative in the case of a standard framework, e.g. "Carbon.framework/HIToolbox.framework/HIToolbox").
"thread-id" is an identifier for the thread, which should occur as an "id" in the symbol table; the upper 16 bits evidently must be 0. Thread symbol table entries have a name and library path which is the string ("Thread_" int16<thread-id>); I have not confirmed whether this is necessary.
Each entry in a @thread block is one sampling of the whole stack of that thread. I do not know what the 1, 0, and 1 mean, but the fourth integer is the number of frames on the stack; immediately after are that many integers, each of which is an id from the symbol table.
Files generated from this structure are accepted by Sampler, but not always by Shark; I don't know why, and my attempt at tracking it down made it seem to depend on the size of the trace file.
Here is code to generate such a file from sb-sprof data; it should be loaded in the SB-SPROF package:
  (defun write-32 (index stream)
    (write-byte (ldb (byte 8 24) index) stream)
    (write-byte (ldb (byte 8 16) index) stream)
    (write-byte (ldb (byte 8 8) index) stream)
    (write-byte (ldb (byte 8 0) index) stream))

  (defun write-sampler-data (stream)
    (format stream "~&@supersamplerV1.0~%")
    (format stream "~&@symboltableV1.1~%")
    (let ((symbols (make-hash-table :test 'equal))
          (buffer))
      (loop with gen = #x00002121
            for i below (- (samples-index *samples*) 2) by 2
            for debug-info = (aref (samples-vector *samples*) i)
            do (unless (or (member debug-info '(trace-start))
                           (gethash debug-info symbols))
                 (let ((index (incf gen)))
                   (setf (gethash debug-info symbols) index)
                   (write-char #\Tab stream)
                   (write-32 index stream)
                   (write-char #\Tab stream)
                   (write-32 0 stream)
                   (let* ((*print-right-margin* nil)
                          (*print-miser-width* nil)
                          (name (princ-to-string
                                  (if debug-info
                                    (node-name (make-node debug-info))
                                    (format nil "Thread"))))
                          (real-info
                           (when (typep debug-info 'sb-di::compiled-debug-fun)
                             (sb-di::compiled-debug-fun-debug-info debug-info)))
                          (source
                           (when real-info
                             (sb-c::debug-info-source real-info)))
                          (pathname
                            (when (and source
                                       (eql (sb-c::debug-source-from source) :file))
                              (sb-c::debug-source-name source))))
                     (nsubstitute #\/ #\Newline name)
                     (format stream "~C~A~C~A~C~A~%"
                             #\Tab name
                             #\Tab pathname
                             #\Tab pathname)))))
      (format stream "~&@threadV1.0~C~4,'0X~%" #\Tab (gethash nil symbols))
      (flet ((out ()
               (when buffer
                 (write-char #\Tab stream)
                 (write-32 1 stream)
                 (write-32 0 stream)
                 (write-32 1 stream)
                 (write-32 (length buffer) stream)
                 (dolist (sym buffer)
                   (write-32 sym stream))
                 (terpri stream)
                 (setf buffer nil))))
        (loop for i downfrom (- (samples-index *samples*) 2) to 0 by 2
              for debug-info = (aref (samples-vector *samples*) i)
              do (cond
                   ((eql debug-info 'trace-start)
                    (out))
                   (t
                    (push (or (gethash debug-info symbols)
                              (error "No symbol assigned to ~S" debug-info))
                          buffer))))
        (out)))
    (format stream "~&@end~%"))
Usage:
(with-open-file (s "sampler.trace" :direction :output
                                   :element-type :default
                                   :if-exists :supersede)
  (sb-sprof::write-sampler-data s))
This code generates a noninteractive Sampler-style tree report from SB-SPROF data.
  (defun make-bucket ()
    (list 0 (make-hash-table :test 'equal)))

  (defun put (bucket name)
    (let ((h (second bucket)))
      (or (gethash name h)
          (setf (gethash name h) (make-bucket)))))

  (defun build-tree ()
    (loop with root = (make-bucket)
          with current = (list root)
          for i downfrom (- (samples-index *samples*) 2) to 0 by 2
          for debug-info = (aref (samples-vector *samples*) i)
          do (cond
               ((eql debug-info 'trace-start)
                (dolist (bucket current)
                  (incf (first bucket)))
                (setf current (list root)))
               (t
                (let ((name (node-name (make-node debug-info)) #|kludge|#))
                  (push (put (first current) name) current))))
          finally (return root)))

  (defun twiddle-tree (bucket)
    (let (entries)
      (maphash (lambda (k v) (push (list* :i k (twiddle-tree v)) entries))
               (second bucket))
      (list (first bucket) entries)))
(Usage for printing a report: (twiddle-tree (build-tree)).)