Apple's Sampler file format, and SBCL SB-SPROF report generation
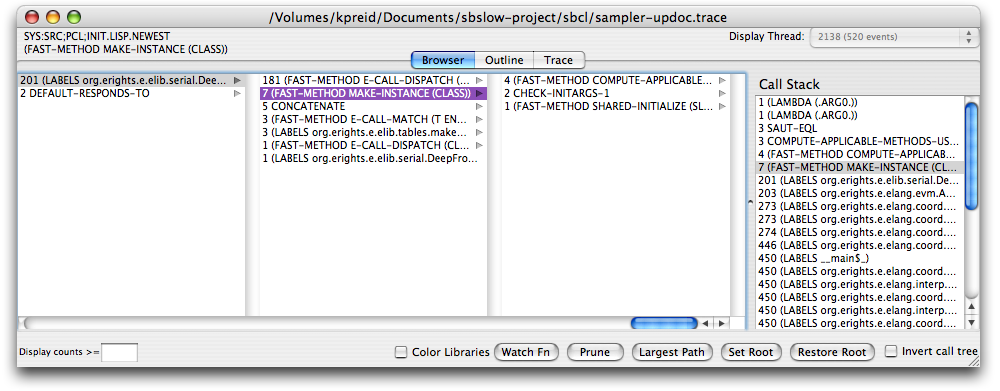
Thursday, June 19th, 2008 10:01Apple's Sampler is a profiler based on the principle of periodically collecting the entire call stack of the executing threads, then summarizing these stacks to show what occurs frequently; primarily, as a tree, rooted at the bottom of the stack, where each node shows the number of times that call sequence was found on the stack.
SBCL's sb-sprof is a profiler which also collects call stacks, but its summary report is much less useful to me as it does not provide the per-branch counting; just top-of-stack frequencies and a caller/callee graph.
Therefore, I examined Sampler's file format and wrote code to generate it from sb-sprof's record.
The file is mixed text/binary, LF line endings. The grammar, as far as I've determined it, is:
  "@supersamplerV1.0" LF
  "@symboltableV1.1" LF
  (TAB int32<id> TAB int32<unknown>
   TAB text<symbol>
   TAB text<library-path> TAB text<library-path> LF)*
  "@end" LF
  (
    "@threadV1.0" TAB int16Hex<thread-id> LF
    (
      TAB int32<1> int32<0> int32<1> int32<count of stack-frame> (int32<stack-frame>)* LF
    )*
  )*
  "@end" LF
where by "int32" I mean a big-endian 32-bit (unsigned?) integer (i.e. four not-necessarily-ASCII bytes), and by "int16Hex" I mean a 16-bit integer in hexadecimal (i.e. four ASCII bytes).
"id" is an arbitrary identifier for this symbol. "unknown" is occasionally nonzero, but I don't know what it means. "symbol" is the name of a function/method found on the stack. "library-path" is the pathname to the object file it was loaded from (relative in the case of a standard framework, e.g. "Carbon.framework/HIToolbox.framework/HIToolbox").
"thread-id" is an identifier for the thread, which should occur as an "id" in the symbol table; the upper 16 bits evidently must be 0. Thread symbol table entries have a name and library path which is the string ("Thread_" int16<thread-id>); I have not confirmed whether this is necessary.
Each entry in a @thread block is one sampling of the whole stack of that thread. I do not know what the 1, 0, and 1 mean, but the fourth integer is the number of frames on the stack; immediately after are that many integers, each of which is an id from the symbol table.
Files generated from this structure are accepted by Sampler, but not always by Shark; I don't know why, and my attempt at tracking it down made it seem to depend on the size of the trace file.
Here is code to generate such a file from sb-sprof data; it should be loaded in the SB-SPROF package:
( SB-SPROF to Sampler )
This code generates a noninteractive Sampler-style tree report from SB-SPROF data. ( SB-SPROF tree report )